Differential
scanning calculation (DSC) is a technique that under temperature
control program, used to determine the relationship between the heat
flow rate or power difference of samples and reference materials, and
temperature or time under program control temperature. DSC has been
widely used in the fields of material processing, chemistry, medicine,
biochemistry, petroleum, aerospace, environmental protection, etc.
Thermal analysis is an important method used in physical property
analysis in raw material analysis to analyze the mineral composition and
chemical composition of raw materials.
DSC is a calorimetric analysis method. Its measurement results are affected not only by material state, but also by factors such as experimental conditions. This paper studies the main factors affecting DSC measurement results and puts forward suggestions that should be considered in DSC measurement.
1.Experiment
Sample: copper alloy, ferroalloy, hydroxyapatite powder, biological glass, microcrystalline glass, calcium carbonate inorganic material, etc.
Atmosphere: Ar;
Reference material: Empty Alumina Crucible;
Heating range: Room temperature to 1450 ℃;
Heating rate: 10 ℃/min;
Model and origin of the instrument: STA 409 PC Germany Nechi;
In order to study the influence of the experimental crucible on the experimental results, the author tested the above materials separately to see what effect the alumina crucible will have on the experimental results.
The following figure shows the DSC and TG curves obtained from the experiment. Figure 1 shows the DSC and TG curves of glass-ceramics powder. It can be observed that the DSC curves have crystallization peaks and the corresponding TG curves have no change, which conform to crystallization kinetics of glass-ceramics. Figures 2 and 3 show the DSC and TG curves of copper and ferro alloy respectively, and there was an endothermic peak for both DSC curves, which was the melting endothermic peak. The corresponding TG curve rose, indicating a increase in sample mass, but the whole experiment was kept under protective atmosphere, it was impossible for the sample to increase its mass due to oxidation, so the only reason was the reaction between the sample and crucible. Figures 4, 5 and 6 show DSC and TG curves of drug powder, inorganic powder and biological glass powder respectively, showing a decrease in TG by various degrees, indicating that the sample was decomposed. The heating temperatures of various samples and the temperature at which the TG curves increase are listed in Table 1.
According to the analysis of the experimental results, it is believed that the alumina sample pan will react with some samples and cause distortion of the TG curve, thus affecting the experimental results. Since "fingerprint information" for thermal analysis of different substances might be required, so the requirements on the experimental conditions are even higher.
Table 1 Heating Temperature and TG Curve Rising Temperature of Various Materials
DSC is a calorimetric analysis method. Its measurement results are affected not only by material state, but also by factors such as experimental conditions. This paper studies the main factors affecting DSC measurement results and puts forward suggestions that should be considered in DSC measurement.
1.Experiment
Sample: copper alloy, ferroalloy, hydroxyapatite powder, biological glass, microcrystalline glass, calcium carbonate inorganic material, etc.
Atmosphere: Ar;
Reference material: Empty Alumina Crucible;
Heating range: Room temperature to 1450 ℃;
Heating rate: 10 ℃/min;
Model and origin of the instrument: STA 409 PC Germany Nechi;
In order to study the influence of the experimental crucible on the experimental results, the author tested the above materials separately to see what effect the alumina crucible will have on the experimental results.
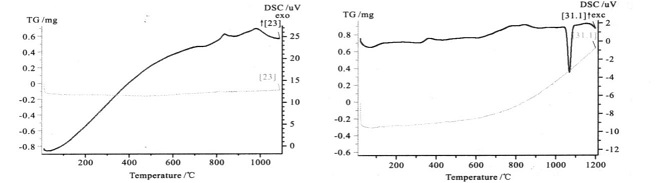
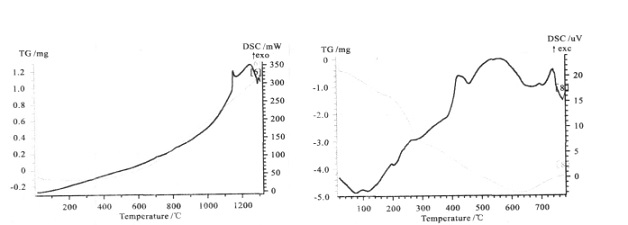
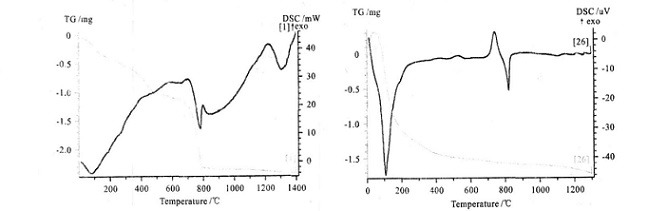
The following figure shows the DSC and TG curves obtained from the experiment. Figure 1 shows the DSC and TG curves of glass-ceramics powder. It can be observed that the DSC curves have crystallization peaks and the corresponding TG curves have no change, which conform to crystallization kinetics of glass-ceramics. Figures 2 and 3 show the DSC and TG curves of copper and ferro alloy respectively, and there was an endothermic peak for both DSC curves, which was the melting endothermic peak. The corresponding TG curve rose, indicating a increase in sample mass, but the whole experiment was kept under protective atmosphere, it was impossible for the sample to increase its mass due to oxidation, so the only reason was the reaction between the sample and crucible. Figures 4, 5 and 6 show DSC and TG curves of drug powder, inorganic powder and biological glass powder respectively, showing a decrease in TG by various degrees, indicating that the sample was decomposed. The heating temperatures of various samples and the temperature at which the TG curves increase are listed in Table 1.
| Figure 1. DSC and TG curves of glass-ceramics powder | Figure 2. DSC and TG curves of copper alloy |
According to the analysis of the experimental results, it is believed that the alumina sample pan will react with some samples and cause distortion of the TG curve, thus affecting the experimental results. Since "fingerprint information" for thermal analysis of different substances might be required, so the requirements on the experimental conditions are even higher.
Table 1 Heating Temperature and TG Curve Rising Temperature of Various Materials
Experimental material
|
Final heating temperature
|
The temperature at which TG curve rises
|
Microcrystalline glass
|
1100 ℃
|
———
|
Hydroxyapatite
|
1400 ℃
|
———
|
Drugs
|
800 ℃
|
———
|
Calcium carbonate, etc
|
1400 ℃
|
———
|
Giological glass
|
1300 ℃
|
———
|
Copper alloy
|
1200 ℃
|
800 ℃
|
Ferroalloy
|
1300 ℃
|
700 ℃
|
| Figure 3. DSC and TG curves of ferroalloy | Figure 4. DSC and TG curves of drug powder |
| Figure 5. DSC and TG curves of inorganic powder | Figure 6. DSC and TG curves of biological glass powder |
评论
发表评论